Profit Forecaster is a planning tool for sales and marketing people in all industries:
- It uses Monte Carlo Simulation to forecast profit. You input a cost profile. Single-point estimates do not capture the distribution of cost inputs from the actual costs.
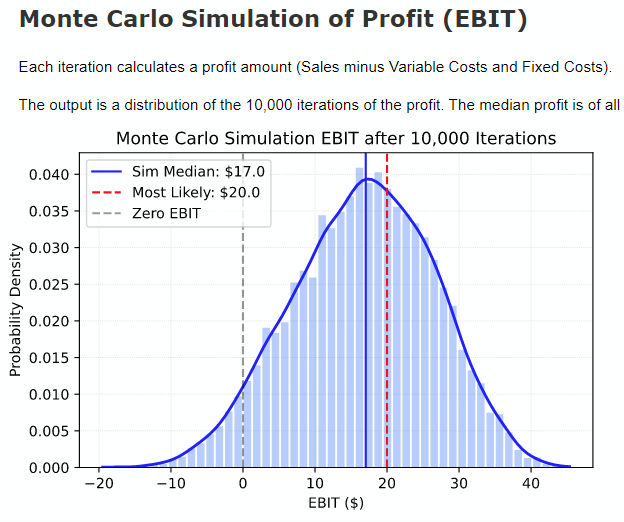
- It produces a distribution (range) of output profit. You see the median profit based on your input cost profile.
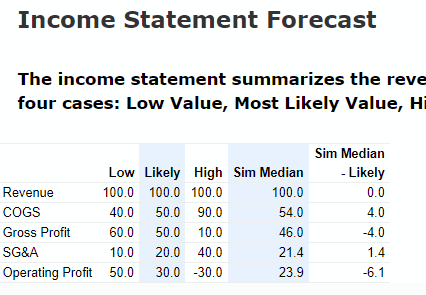
- It displays an income statement showing the likely (single-point) profit compared with the simulated (distribution of) profit.
- You see how the costs contribute to the variance in the profit. See how the cost profile affects the contribution.
- Learn how Monte Carlo Simulation can improve your forecasting and improve your business.
Run Mova Profit Forecaster
Select values for Variable Cost and Fixed Cost from the sliders below:
The cost amounts are calculated by multiplying the cost rates by the Sales amount. Higher cost rates make higher cost amounts, which lower profit.
It’s easy. It’s free. No signup or registration. The app takes a few seconds to run. Please be patient.
Why forecast profit using a Monte Carlo Simulation?
- Forecasting profit is inherently uncertain due to the uncertainties of the revenues and the costs. This tool reduces forecasting uncertainty by using a Monte Carlo Simulation to estimate the variable and fixed costs.
- The traditional method of forecast specifies a point estimate for variable and fixed costs, which leads to a single number for profit. But the actual costs will likely be higher or lower than the estimate. There is no way to measure the uncertainty in the forecast.
- Monte Carlo Simulation is one method for managers to reduce forecast uncertainty and be more confident in their sales and financial plans.
- The Monte Carlo Simulation uses a range (distribution) of the costs to generate a range (distribution) of possible profit. It shows the probability of the simulated profit being higher (or lower) than the point estimate. It adds a measure of the certainty to the profit forecast.
- Using a Monte Carlo Simulation shows you a range of forecast Profit, which gives you more confidence in your forecasts and forecasting skills.
- Using a Monte Carlo Simulation of costs for calculating profit enables you and your managers to discuss the drivers of your costs in more detail, such as why are actual costs skewed. Or why it is important to lower the floor of variable costs and reduce the long tail of costs.
Use Mova Profit Forecaster for:
- Understand your costs:Learn how the cost values you specify affect the likelihood of various ranges of profit.
- See probabilities: Learn the probability of the profit exceeding the most likely estimate of profit, or any level of profit.
- Cost profile: See how the cost profile affects the income statement.
- Costs affect profit: See how profit is sensitive to the range and profile of the costs. Compare the sensitivity of profit to the variable costs with that of the fixed costs.
- Better forecasts: Gain insights into making more detailed forecasts so you are more confident in the forecast profit.
- More control: Avoid being overly optimistic or pessimistic in your estimate.
How Mova Profit Forecaster works
- You select a range of input values (low, most likely and high) for the Variable Cost Rate and the Fixed Cost Rate.
- The program makes a Beta distribution for the Variable Cost Rate and the Fixed Cost Rate.
- It uses the Monte Carlo method to randomly sample costs from the distributions.
- The program calculates the Profit (EBIT) as Sales minus Costs. The simulation Profit is a distribution (range) of estimated profit values.
- It shows the cumulative density function to see the probability of the simulation profit exceeding the most likely estimate of profit.
- Table of Income Statement shows the range of costs and profit.
- The sensitivity analysis shows the share of variance in the simulated Profit from the Variable Costs and the Fixed Costs.
Why use Mova Profit Forecaster
- It is a simple to use program that shows you how a Monte Carlo Simulation is used to forecast profit.
- You learn how the set profile of costs affects profit.
- Get ideas for using Monte Carlo Simulation to forecast other metrics in your business, such as sales, borrowing, marketing response, inventory, supply chain, risk, and project management.
Sample Report
Sample output report from Mova Profit Forecaster


